
The Future of Housing Occupancy: Montreal CMA
Demographic Growth & Change

Over the past 17 years, Montreal has added 629,958 new residents to its population (for 19 percent growth), going from 3.36 million people in 1996 to 3.99 million by 2013. Annual growth rates over this period generally increased, rising from 0.5 percent in the mid-1990s to one percent in 2000. While a slight dip was seen in the mid-2000s, rates increased again to 1.4 percent for 2009, 2010 and 2011, before easing slightly to 1.2 percent by 2013.
In considering patterns of aging, mortality, natality, and migration, the Montreal CMA is projected to welcome just over one million new residents by 2041, growing from its current 3.99 million people to 4.99 million by 2041. That said, the CMA is projected to grow at a slower pace than in recent years, with annual population growth expected to slow towards 0.9 percent through the mid-2020s, and further to 0.6 percent by 2041. This pattern of slowing growth reflects a moderation of currently-high migration levels, as well as the aging of the existing population both into the higher mortality stages of the lifecycle and out of the prime childbearing stages.
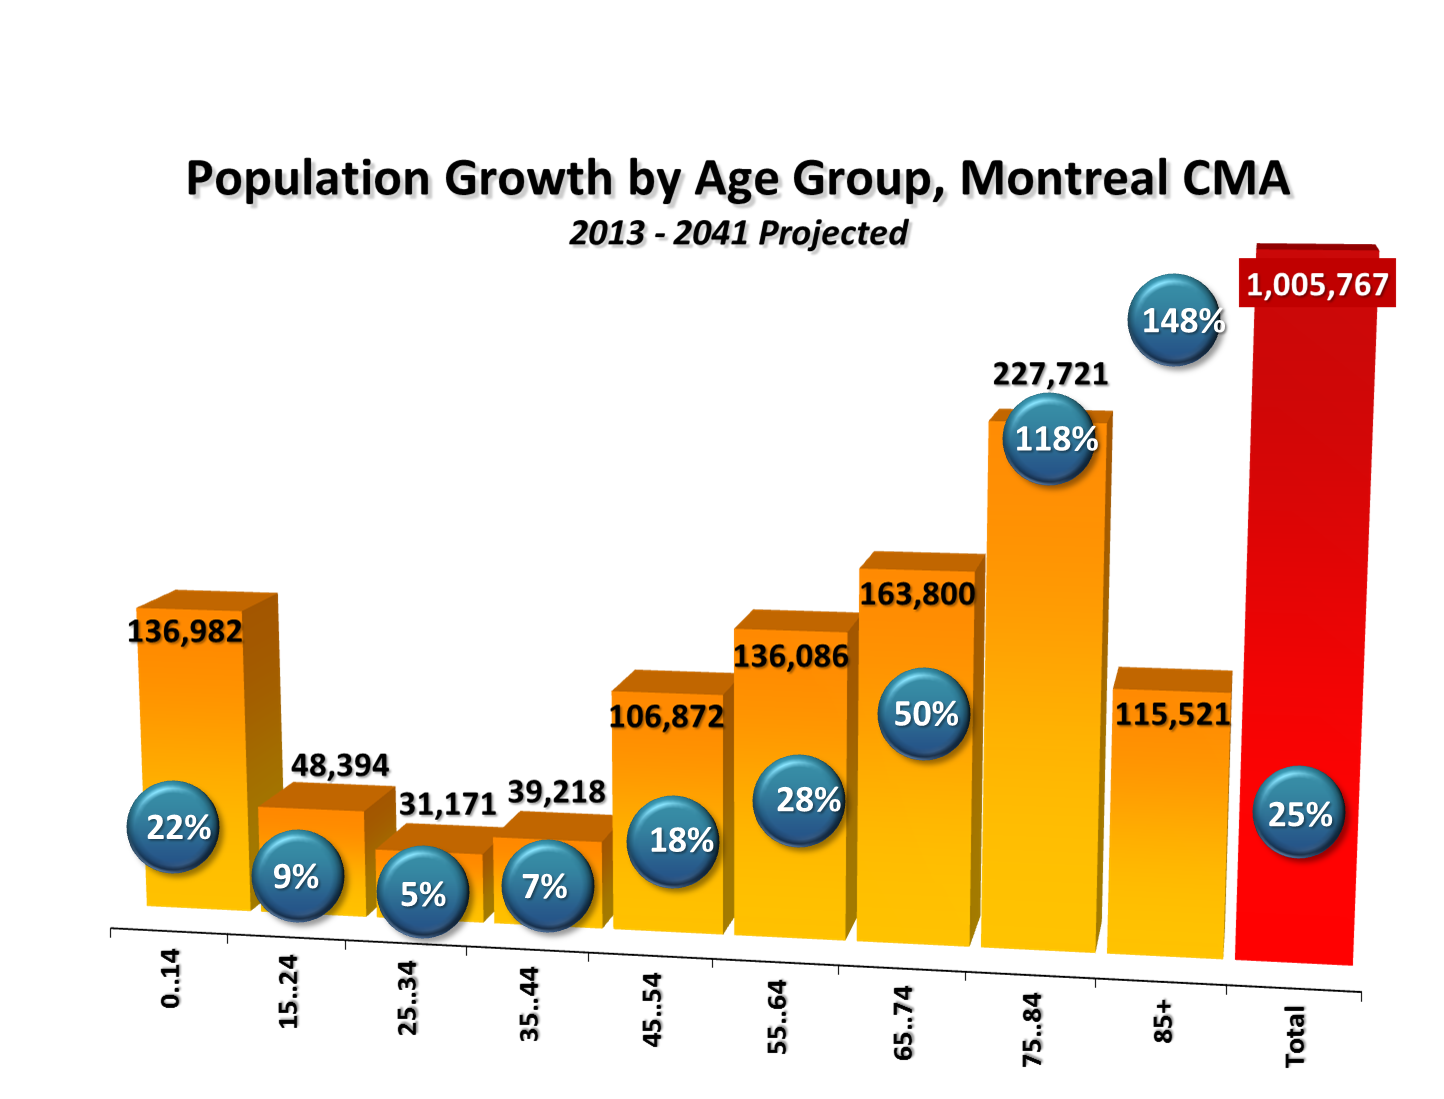
With respect to changes in the composition of the region’s population, as at the national level, the greatest relative growth will be in the older age groups. Each of the 55-plus age groups is expected to grow at a faster rate than the population as a whole, while each under-55 group is projected to grow more slowly.
Overall, it is important to bear in mind that while migration will have an impact on the composition of Montreal’s future population, the aging of the region’s existing residents will, to a large extent, shape tomorrow’s population. For example, 85 percent of today’s residents would be alive, and potentially living in the CMA, by 2033, and 74 percent would still be around by 2041.
Housing Occupancy Demand by Structure Type

Using the most recent Census and National Household Survey data it is possible to illustrate the lifecycle pattern of housing occupancy in the Montreal CMA. Although half of Montreal’s dwelling stock is apartments, which is significantly higher than the 20 to 40 percent in other CMAs, similarities are seen in the general lifecycle pattern of maintainer rates across geographies. For instance, ground oriented maintainer rates in the Montreal CMA generally rise through the late-40s age group, and are greater than apartment rates between the ages of 35 and 74. A drop-off in ground oriented rates characterize the 60 and older age groups, with only 18 percent of those aged 85-plus maintaining a household in a ground oriented unit.
Apartment household maintainer rates in Montreal substantially exceed ground oriented rates for ages 15 to 34 and among those 75 and older. Apartment maintainer rates also peak through the older stages of the lifecycle, reaching 35 percent for the 75 to 79 age group before declining to 29 percent for those 85 and older.

Combining the trends in the lifecycle patterns of household maintainer rates with the pattern of demographic growth and change expected for the Montreal CMA between 2013 and 2041 would result in private household occupancy demand growing by 487,993 units over the next 28 years. Relatively high maintainer rates among the older age groups, combined with these age groups experiencing the greatest relative and absolute growth, will result in total housing occupancy demand growing faster than the region’s population: 25 percent growth in total population would yield a 29 percent increase in total housing occupancy demand in the CMA over the course of the projection period.
Changing demography will also impact the type of housing demanded. Additional demand for apartments is projected to outweigh that for ground oriented formats: 254,291 additional apartments would be required to house projected population change to 2041 versus 233,702 ground oriented units. The apartment segment of the market would also see the greatest relative growth at 30 percent, while the demand for ground oriented housing would grow by 28 percent over the coming 28 years.
Housing Occupancy Demand by Tenure Type
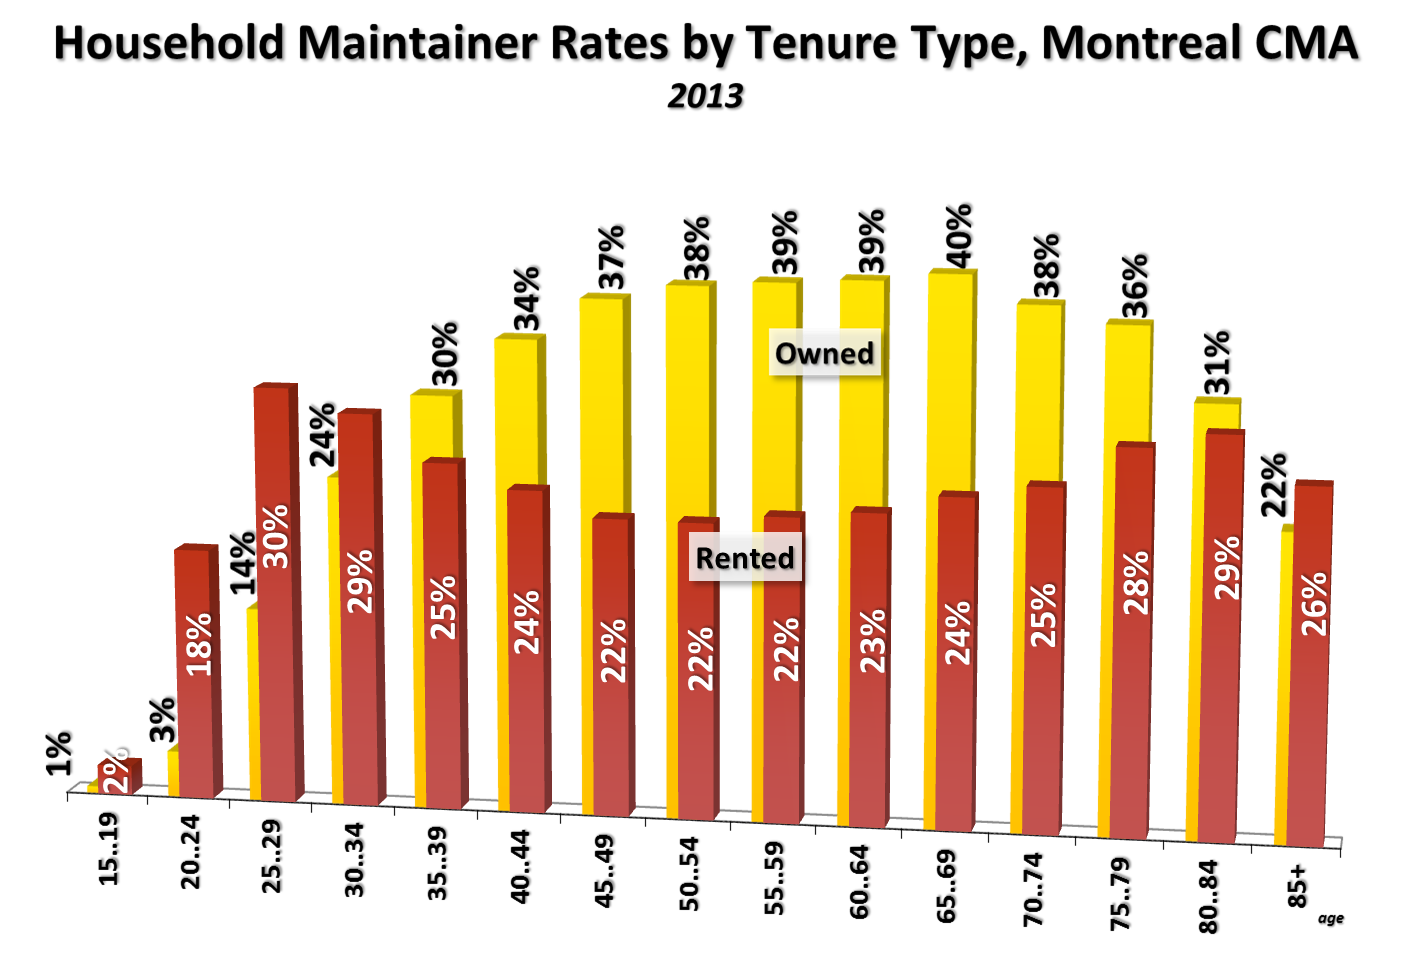
A strong lifecycle pattern is also associated with household maintainer rates when housing occupancy is considered on a tenure basis. In the Montreal CMA, owner-occupied maintainer rates increase significantly through the family formation and family rearing stages of the lifecycle, going from a low of only one percent of people in the 15 to 19 age group owning to a relatively stable 34 to 40 percent of 40 to 69 year olds owning their home. Owned maintainer rates begin to decline for the 70-plus age groups, as some people decide to leave their owned accommodation for rental housing (as evidenced by the increase in rented maintainer rates in the 70-plus age groups) and others move into collective care environments such as nursing homes or hospitals (some also move in with relatives).
With respect to the lifecycle pattern of rental maintainer rates, there is a significant increase in the post-secondary/labour force stages, with rental maintainer rates going from one percent in the 15 to 19 group to 30 percent in the 25 to 29 segment—the highest of any age group. As indicated above, rental tenure again becomes increasingly important through the latter stages of the lifecycle, with rental maintainer rates for the 80 to 84 group almost matching rates for those aged 20 to 29.

In looking forward, trends in these lifecycle patterns would see the additional demand for owned units outnumbering that for rented dwellings. Between 2013 and 2041, the owned segment of the Montreal CMA’s market is projected to increase by 32 percent, with the owned stock growing from 929,177 units today to 1.23 million by 2041. Occupancy demand for rental units, on the other hand, is projected to increase by 24 percent, growing from 764,940 units in 2013 to 953,150 by 2041. In absolute terms, an additional 299,783 owned units would be required to house Montreal’s residents over the coming 28 years versus 188,210 net new rental units.


Click here to download a PDF version of a summary for Canada and selected CMAs, including this one.
Click here to download a PDF version of our full report.
© 2014 Urban Futures