
Travel & Tourism
Andrew Ramlo, Ryan Berlin, & Yazmin Hernandez
The Urban Futures Institute

A wide range of factors influence people’s ability and desire to travel, and therefore their propensity to do so. While over the long-term demographics may play a significant role in determining how much—and the way in which—people travel (think of Canadian snowbirds wintering in Arizona and Florida, and no longer making the daily commute from their home to the office), shorter-term factors centre on economics (generally) and on one’s ability to pay (more specifically). With these factors in mind, this brief document presents an overview of general travel patterns to British Columbia and Canada between 1998 and 2011 as well as changes in several economic dimensions that, to some degree or another, have influenced the extent of travel and tourism in this province.
Traveller Entries
Currently, travellers from the United States represent 75 percent of all international inbound travellers in Canada. Over the past 14 years, annual inbound travel volume to Canada from the United States has declined by 48 percent, from 48 million trips in 1998 to 25 million in 2011. That said, while each of the eleven years leading up to 2011 registered a decline in Canada-bound travel from the US, there was a marginal increase (1.6 percent) in 2011, with there being almost 400,000 more entries in 2011 than in 2010.
The volume US traveller entries to Canada via British Columbia has followed a similar trend. Since 1998, the number of Americans entering BC has declined by 36 percent, with there being 2.4 million fewer American entries to Canada through BC in 2011 than there were 13 years earlier. The number of US entries to BC peaked in 2000, when over seven millions American travellers entered Canada through BC. Following the largest year-over-year decline in American travel to BC (12 percent between 2007-2008), the number of US travellers entering BC has since declined at a slower pace (with there actually being a 1.8 percent increase between 2009-2010).
From a travel and tourism perspective it is also important to consider the mode split of US travel to BC, which has shifted considerably over time. For example, the share of US visitors travelling to BC by automobile fell from 71 percent of all trips in 1998 to 62 percent by 2011. This was driven by a 39 percent decline in total automobile travel to the province from the US, from 4.6 million trips in 1998 to only 2.8 million by 2011. In contrast, while also experiencing a decline (from 945,000 to 819,000 trips over the same period), the share of entries via airplane increased from 15 percent to 18 percent, while all other modes—which includes ship, bus, and rail—declined by five percent between 1998 and 2011 and accounted for 20 percent of the total volume of US travellers entering BC in 2011, up from 15 percent in 1998.
Non-US (i.e. overseas) entries to BC have declined by eight percent since 2008, with the most significant decline being the 13 percent drop between 2008-2009, reflecting the relatively widespread and high degree of economic turmoil at the time. On the heels of an increase between 2009-2010 (of nine percent), overseas travel to the province again fell last year (by three percent between 2010-2011).
Total Aircraft Movements
With specific respect air travel, a significant decline in total aircraft movements (cargo and passenger take-offs and landings) in BC has been seen since 2007/2008. While there was a rapid increase in the mid-2000s, total annual scheduled aircraft movements at all BC airports with NAV Canada towers have fallen by 19 percent since 2008, or by almost 240,000 movements. It is interesting to note that a more significant decline has been seen at the smaller airports (Abbotsford, Boundary Bay, Kelowna, Langley, Pitt Meadows, Prince George, and Vancouver Harbour) throughout the province, with movements falling by 22 percent (167,000 flights) compared to a 14 percent drop at the Vancouver and Victoria international airports (72,000 fewer flights) over this recent period. This recent and short-lived spike and decline in aircraft movements notwithstanding, a general pattern of decline in the annual number of total aircraft movements in BC was seen between 1998 and 2011, falling by 21 percent over the period (270,000 fewer annual movements).

Hotel Occupancy Rates
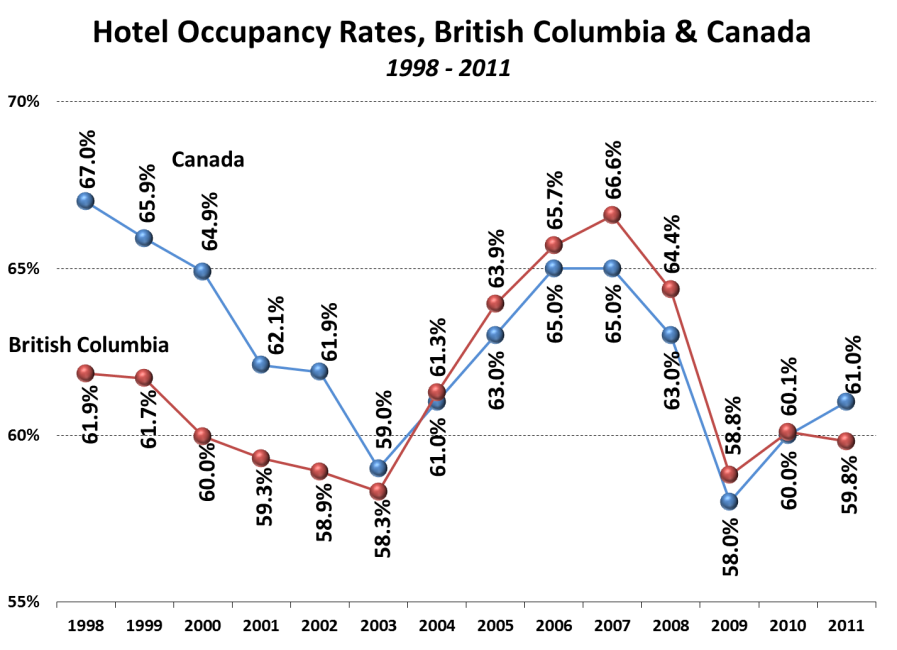
Downward trends in travel have also been reflected in hotel occupancy rates for Canada and BC. For example, in 1998, Canada’s hotel occupancy rate was 67.0 percent, while BC’s rate stood at 61.9 percent; after experiencing five years of decline, occupancy rates for both BC and Canada had fallen below 60 percent by 2003 (to 59.0 percent and 58.3 percent, respectively). The mid- to late-2000s saw occupancy rates recover somewhat, increasing to 65.0 percent Canada-wide and to 66.6 percent in BC by 2007. For BC this represented the highest hotel occupancy rate seen between 1998 and 2011, and for Canada the highest rate recorded since 1999. The post-2007 period has seen both national and provincial occupancy rates decline. By 2011, BC’s occupancy rate had declined to 59.6 percent (ten percent below the level seen in 2007, but above the 58.8 percent seen in 2009), while Canada’s rate had fallen by six percent to 61 percent occupancy (again, above the 58.0 percent seen in 2009).
While a wide range of factors have influenced these patterns of travel to, and within, British Columbia in recent years, the economic drivers to travel are generally easier to quantify than the more qualitative aspects. As such, the following provides a brief overview of some of the broad economic dimensions that have likely contributed to the changes outlined above.
Factors Influencing Travel to BC
Unemployment rates: BC, Canada, US, & the European Union
In the aftermath of the global financial crisis that came to a head in 2008 and 2009, unemployment rates increased sharply throughout Canada, the United States, and the European Union. South of the border, the unemployment rate increased from a historical monthly average of 4.6 percent in 2006 and 2007 to 9.6 by 2010. Data for 2011 show a slight decline in the unemployment rate from its 2010 peak (to 9.0 percent), with more recent monthly data revealing further declines (albeit slight) as the rate of employment growth in the US has finally begun to increase.

Similarly, Canada’s unemployment rate increased from a historical low of 6.1 percent in 2007 and 2008 to reach 8.3 in 2009. From this peak the Canadian unemployment rate fell to 8.0 in 2010 and further to 7.5 percent in 2011. Although lower than the Canadian average since 2004, British Columbia’s unemployment rate also saw a sharp increase, increasing from a historic low of 4.3 percent in 2007 to 7 .7 percent in 2009. By 2011 BC’s unemployment rate had declined marginally to 7.5 percent.
The situation in the 27 member countries which make up the European Union has been similar: a historic low of 7.1 percent was reached in 2008, followed by a sharp increase in the unemployment rate thereafter. Unlike Canada and the United States however, the unemployment rate continued to increase in the EU, reaching 9.7 percent in 2010, where it remained through 2011.
Gasoline Prices
While gasoline prices—which directly impact that cost of taking trips, no matter the mode of transport—remained relatively stable in Canada during most of the 1990s and through the early-2000s, the last five years have been characterized by climbing prices.
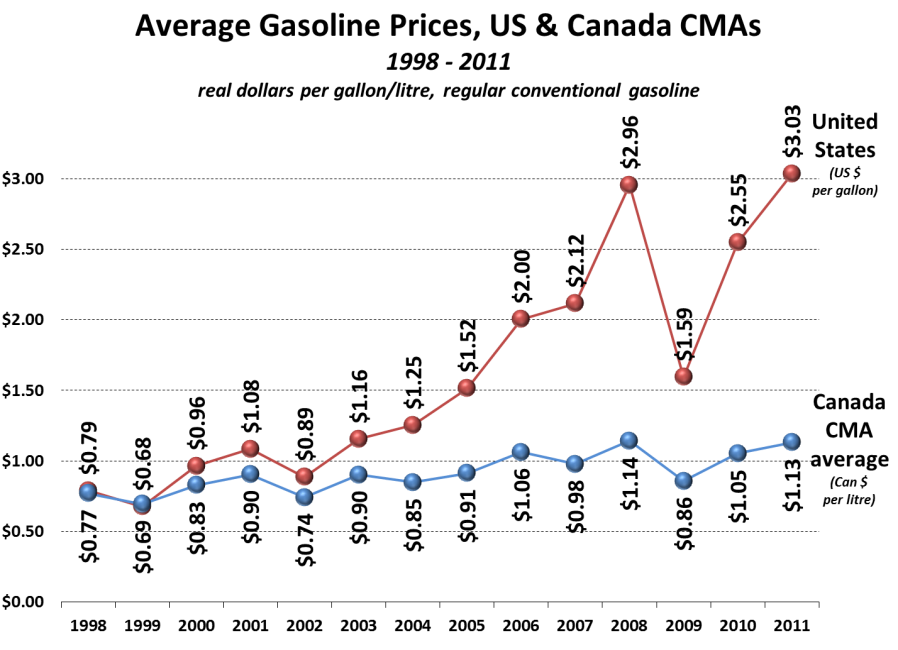
The real (i.e. inflation-adjusted to 2011 dollars) per-litre cost of gasoline in Canada increased by 57 percent between 1998 and 2011, going from $0.77 to $1.13. Gasoline prices in the United States have seen a more dramatic increase, with the real gasoline price per gallon going from $0.79 in 1998 to $3.03 by 2011. This 184 percent increase in the real cost of gasoline over the past 13 years has undoubtedly affected the propensity for Americans to travel generally, and to travel to BC and Canada more specifically.
Exchange Rates
Tracking the Canadian dollar (CAD) exchange rate for US dollars (USD), British pounds (GBP), and the Euro since 1998 illustrates the significant gains experienced by the Canadian dollar over this period. For example, when the Euro was introduced in the first quarter of 1999, it traded at $1.70CAD; by the second quarter of 2012 (13 years later) the rate stood at $1.29, a 24 percent decline. All else being equal, this relative decline in the value of the Euro would have made it increasingly expensive for Europeans to travel to Canada over this period.

Similarly, while the USD traded at $1.43CAD at the beginning of 1998, by the second quarter of 2012 its CAD value had fallen to $1.01. This 30 percent decline would have made it more expensive for US travellers to come to BC over this period (again, all else being equal), and thus provides some context for the decline in both US inbound travel to BC and Canada and hotel occupancy rates. The GBP suffered the most significant depreciation relative to the CAD over this period: from $2.35CAD at the beginning of 1998, the GBP’s value declined to $1.60CAD—a 32 percent loss in value—by the first quarter of 2012.
Strategic Considerations
The short- and long-term implications of historical data for travel in, and to, BC should be considered independently, as the factors driving the long-term decline in US travel to the province differ from those behind the short-term decline experienced since 2008.
In looking forward over the short-term, the unemployment rate south of the border is expected to continue its recent decline; this will largely be due to a US economy that is expected to grow by 2.5 to 2.7 percent annually over the next few years, thereby spurring continued (albeit slow) employment growth.
In taking a longer-term view it is important to note that the US population grows by roughly one Canada—34 million people—every 10 to 15 years (this growing population, and growing younger population, contrasts the situation in the EU). Thus, the long-run demographic context underpinning US travel to Canada might be more positive than many anticipate. That said, from the perspective of attracting visitors to this province it will certainly be important to focus efforts on broadening BC’s global brand. Following the shift in global economic activity away from the west and towards east, significantly growing populations throughout the Asia Pacific region, combined with increasing standards of living, will see countries in that part of the world play an increasingly important role in the context of travel and tourism in BC in the coming years.
With respect to the value of the Canadian dollar, and to the extent that exchange rates largely reflect interest rate differentials, there is little evidence suggesting that there will be a significant shift in the value of the Canadian dollar in the short- to medium-term. To the extent that commodity prices and the dominance of commodities in Canada’s export mix influence the value of the Canadian dollar, little downward pressure on the Canadian dollar is expected as global economic activity recovers and commodity prices firm up. Conversely, upward pressure on the dollar will be mitigated as global growth in the demand for commodities will largely be offset by a growing commodity supply in BC’s competitor countries around the world.
Data Sources
“Travel Entries to Canada via British Columbia”, page 1
Statistics Canada. CANSIM table 427-0001 (Last updated on: 2012-09-17; coverage: Jan. 1972 to Jul. 2012).
“Hotel Occupancy Rates, British Columbia & Canada”, page 3
BC Stats, Tourism Sector Indicators www.bcstats.gov.bc.ca/Files/94909c0b-7e65-45bd-bba9-7be80af86d85/TourismIndicators1205.xlsx
Canadian Hotel Association. Hotel Industry Fact Sheet (Last updated: Oct. 10, 2012) www.hotelassociation.ca/forms/Hotel%20Industry%20Facts%20Sheet.pdf
“Unemployment Rates”, page 4
Statistics Canada’s Labour Force Survey.
Labor Force Statistics from the Current Population Survey. Unemployment Rate (Series Id:LNS14000000 - Seasonally Adjusted. Type of data: Percent or rate, Years: 1992 to 2012).
Eurostat. European Union (27 countries)-Unemployment Rate (2002-2011) http://epp.eurostat.ec.europa.eu/portal/page/portal/euroindicators/data/database
“Average Gasoline Prices, US & Canada CMAs”, page 4
Energy Information Administration. (File name: pswrgvwall.xls, last updated on: 2012-10-15) www.eia.gov/oil_gas/petroleum/data_publications/wrgp/mogas_history.html
Statistics Canada (CANSIM table 326-0012, last updated on: 2012-09-20)
“Quarterly Canadian Dollar Exchange Rates, Major Currencies”, page 5
Statistics Canada. CANSIM table 387-0006 (Last updated on: 2012-09-27; coverage: 1Q-1986 to Q2-2012).