
By the Numbers: The International Context for BC's Economy
The Urban Futures Institute

Introduction
This document summarizes one part of a discussion of the near-term future of British Columbia’s economy and its international context that accompanies the variety of demographic and economic projections prepared annually by Urban Futures. It is based on the review of the wide range of data and analyses that are used by Urban Futures to condition the mathematical trend analysis that form the inputs to its forecasting models. As elements of this discussion supplement the interpretation of the output from these models, we provide this brief transcript for interested readers.
There are two sets of economic factors that affect the performance of the provincial economy: those that originate outside of the province, and hence are largely beyond our control; and those that originate within the province, and hence can be influenced to some degree. The most significant external economic factors include interest rates, the value of the Canadian dollar, and the effective demand for the BC’s exports (from both other provinces and internationally). The most significant internal economic factors are the supply of the province’s exports, domestic demand (for both provincially-produced goods and services and those imported from outside of the province), government spending, and capital investment. Having noted that these factors can be grouped according to whether they are external or internal, clearly there are interactions among them, most specifically through the impact of external factors on internal ones (e.g. the impact of interest rate changes on capital investment, or the impact of changes in the value of the Canadian dollar on provincial exports).
In this review we consider one set of the external factors—those that relate to the international economic environment—and hence interest rates, exchange rates, and exports are the focus here. It is necessary to preface the following discussion by recognizing that we are currently in the midst of significant political uncertainty internationally, including but not limited to the US fiscal cliff, the resolution (or lack thereof) of the sovereign debt issues in the Euro zone, the direction that will be adopted by the new leadership in China, and the just-called election in Japan. Underlying our comments about future external economic conditions is the assumption that the consequences of these political matters on economic conditions will generally adhere to the pattern that they have followed over the recent past. For example, there is the assumption that there will be no sudden, significant, or clear resolution of the sovereign debt issues in the Euro zone; that the US will not plunge over the fiscal cliff, but will step off a fiscal curb; that the new leadership in China will be as concerned about internal stability as the last one; and that Japan will continue to recycle parties and leaders. Should there be a radical departure from these assumptions, then there may well be a much different international political, and hence economic, context for the province than we anticipate.
I Interest rates
Given the current economic environment in the USA and Europe—slow GDP and employment growth, and low inflation—and the strength of the Canadian dollar relative to the US dollar and Chinese yuan, there is little likelihood of a significant or sudden increase in interest rates either in Canada or the United States (or anywhere else) in the near term, and hence minimal risk of an interest rate shock for the BC’s economy. There is potential for a very modest rate increase in Canada in 2013—assuming the successor to Mark Carney does not introduce a radically different approach to setting Canada’s monetary policy—but it will be more as a leading signal than as a real change. Instead, it will be in 2014/2015 and beyond, when the US has begun to bring its lending rate up, that we will see any noticeable increase in interest rates in Canada. These mid-term increases will be incremental and well choreographed, giving governments, businesses and households that have significant debts a number of years to adapt.
Parenthetically, the expectation of a relatively stable, and low, interest rate environment holds significant implications for households in Canada. As we all know, much ado is made about household debt levels in this country; however, given that in Canada we benefit from what are generally considered prudent lending practices, the effective concern is not so much debt levels per se, but rather the consequence of these debt levels on households when interest rates rise. In an environment of low rates, and of predictable incremental increases (when they begin), households can respond to the incentives of rising rates by cutting borrowing and increasing saving. Thus, if we can accept that lending practices are of satisfactory standards in Canada, the focus should shift from worrying about debt levels to ensuring that the pattern of interest rate increases is smooth and generally anticipated and that there is a stable pattern of growth in employment and incomes.

II The Canadian Dollar
In discussions about movements in the value of the Canadian dollar, it is important to establish the context. While the late-1990s and early-2000s are frequently used as a reference point for the currently “expensive” Canadian dollar, its value a decade ago represented a low point for its value against the US dollar in the post-World War II period.
The appreciation in the Canadian dollar during the past decade was partly a recovery to average historical levels, and partly incremental growth beyond this level. Additionally, when compared to the currencies of British Columbia’s other major export clients, most of the increase in the purchasing power of the Canadian dollar occurred in the first half of the past decade, with the value of the dollar generally holding constant or falling since then.

In relation to the US dollar, the Canadian dollar appreciated by 63 percent over a five-year period in the 2000s, from each US dollar costing $1.57 Canadian in October of 2002 to only $0.97 in October of 2007, a level that has generally prevailed since October of 2009. Similar appreciation over the 2002 to 2007 period was recorded for the Canadian currency against the Japanese Yen and the Taiwanese dollar (50 percent appreciation), and 46 percent appreciation against the Chinese Yuan. Since then, the dollar has fallen in value against these currencies, and hence, while being of greater value now than in 2002, it is of lesser value than it was in 2007. The appreciation of the Yen against the Canadian dollar over the past four years has essentially erased all of the appreciation that the dollar saw relative to the Yen prior to 2007, with the Canadian dollar now purchasing 80 Yen, compared to 79 Yen in 2002. In the case of the South Korean Won, the dollar peaked later (in 2008), about 40 percent above its 2002 level, and has remained at that level.
To the extent that exchange rates reflect interest rate differentials among countries, there is little to suggest that there will be significant shifts in the value of the Canadian dollar in 2013 or in the mid-term to follow. Similarly, to the extent that commodity prices and the dominance of commodities in Canada’s export mix affect the Canadian dollar, we do not expect there to be any significant shifts in the relative value of the Canadian dollar, as much of the recovery in commodity prices that will follow the modest growth in the world economy (outside of Europe and Japan) will be largely offset by the growth in the supply of commodities from competitive producers. Consequently, we should see relative stability with respect to Canadian dollar exchange rates with the US, South Korean, and Taiwanese currencies over the next couple of years. With the political transition having now occurred in China and a renewed focus on the economy in that country, there is the potential for some continued appreciation of the Yuan (although it is currently tied, within a range, to the value of the US dollar) and, as Japan slides into recession, we will see an end to the appreciation of the Yen.
III Exports
Exports form a critical component of BC’s economy, as they earn us the money to pay for the vast array of imports that draw money out of the province. In the international context, our export income is largely earned from the sale of goods (accounting for 75 percent of international export earnings in BC), with the sale of services to purchasers outside of Canada accounting for the remaining one-quarter.

1 International Merchandise Exports
In consideration of the export context for British Columbia’s economy over the next few years, it is important to look at the current mix of both the destinations and types of our export products, as they are quite different—and more diverse—than they were in the past. While we generally think of ourselves as an exporter of forest products (they represented 32 percent of the value of our international exports during the first three quarters of 2012), our energy exports (27 percent) are almost of equal value; furthermore, coal exports bring as much money into the province as do wood exports (19 percent). And while we generally see ourselves as exporting to the United States (44 percent of the value of our exports this year have gone to the States), we export almost as much to East Asia (40 percent); in fact, we export more forest products to East Asia (15 percent of all exports during 2012) than we do to the US (14 percent). Thus, while there is a natural and historical inclination to focus on the prospects for the US economy when discussing the external context for BC, equal attention should be given to East Asia.

2 Merchandise Exports to the US
The total value of BC’s merchandise exports to the US has generally declined since the early-2000s’ plateau in the $22.2 billion range, to a decade low of $12.9 billion in 2009, before rebounding slowly to reach a projected $14.4 billion for 2012. In terms of share, the US accounted for a record 70 percent of our merchandise export market in 2001, a proportion that has steadily declined since then, dropping below 50 percent in 2008 to a two-decade low of 43 percent in 2011. The slight rebound in 2012 has been based on an increase in sales to the United States and a decrease in sales to the rest of the world.

While we generally see ourselves as exporting forestry products to the US (and hence the extreme level of interest in the softwood tariff dispute and the collapse and subsequent slow recovery of the US housing market) they actually account for only 31 percent of our US-bound exports—about the same as fabricated and manufactured goods (33 percent). Energy exports account for 19 percent.

The drop of 27 percent in BC’s exports to the US between 2008 and 2009 affected all sectors, with the greatest proportionate decline occurring in energy exports (a 39 percent decline) and the smallest occurring in fishery and agriculture exports (a four percent drop). The eleven percent growth experienced between 2009 and 2012 (estimated) has not been uniform across all sectors, with natural gas exports and pulp and paper exports continuing to fall (by 25 percent and 17 percent, respectively).
The diversity of our exports to the United States requires that we consider the overall health of the US economy as well as the two important sectors—forestry (and specifically wood) and energy—in discussions about the context for BC’s economy.
US economic growth. It must be understood that the pre-recession GDP growth in the US cannot be considered the norm; as the recession demonstrated, the pre-recession period was an aberration, and the excesses of the pre-recession period will shape the future of the US economy for a long time. In terms of US consumer confidence, it will take a significant amount of time before households will be willing or able to undertake significant consumption spending beyond their income growth (as was the case pre-recession). Additionally, the US population is aging, with its baby boomers heading for retirement as fast as ours, and their concerns about heath care and pensions will increasingly shape policy and markets at both the national and state level. The stripping out of pension and health care provisions from contracts, combined with the asset loss in housing value, will drive concerns regarding the provision of resources for retirement, and as a result increased saving will slow household consumption spending. And then, of course, there is the whole issue of government debt (federal, state, and municipal), which will serve to check any potential growth in government spending. Further, the repayment of debt to creditors outside of the United States will result in a significant outflow from the US economy, and possibly even a further depreciated US dollar.
It is therefore anticipated that the US economy will continue to recover towards a long-run trend growth rate of 2.5 to 2.7 percent annually, a future shaped by a fundamental change in focus towards debt reduction and reduced expectations for the US economy.
Having noted the aging of the United States’ population, it is important to note that in the longer-run the US will have both a growing population and a growing younger population—and this is in contrast to the populations of the European Union and East Asia. Thus, the long-run demographic growth potential of the US is significantly different from, and more positive than, that of other global marketplaces.

US housing starts. Over the past year, the excess vacancy of housing units in the United States has been reduced by 658,000 units (as the result of re-occupancy and demolitions), and over the past three years (since the 2009 peak of 2.8 million more vacant units than there would be at long term vacancy rates) the excess vacancy has been reduced by 900,000 units. This is the good news, as these vacant units compete with new residential construction, and hence the fewer vacant units there are, the better the environment for housing starts and BC forest industry (through exports).
The bad news is that there are still 1.9 million more vacant housing units in the US than there should be given long-run vacancy rates. It will take two to three years of fairly healthy growth in occupancy demand to absorb this excess. Given this vacant stock, and considering trends in population growth and household formation in the US, it is anticipated that housing starts will grow from 725,000 unit this year (2012) into the 900,000 to one million starts per year range for 2013 and 2014, and further into the 1.4 million range during the 2015 to 2017 period.
The potential benefit for BC’s forest industry of growing housing demand in the US will be dampened somewhat by supply issues here in British Columbia. The full effect of the pine beetle devastation will be felt in the coming years, with forestry-related employment set to decline as the industry finishes harvesting dead trees. Once the beetle-damaged wood is cleared, some areas (including Prince George and Williams Lake) will see their amount of harvestable timber decline dramatically.

Energy Exports to the US. BC’s energy exports to the United States are primarily natural gas, followed by other energy (mainly oil) and then electricity. However, any discussion of energy exports to the US has to take into account the dramatic transformation that US domestic energy supply is currently undergoing. Shale gas and conventional oil exploration are putting the US on the path to energy independence, not only freeing it from relying on imports, but also putting it in the position of becoming a net energy exporter. The IEA projects oil self-sufficiency within 15 years, and the net exporting of oil by 2025. With the US projected to be the world’s largest oil producer in five years, shale gas exploration continues to expand, with the US expected to be the world’s largest natural gas producer within three years. This year the US is on track to achieve a record level of coal exports.
While such projections may be tinged with a bit of optimism, there is no question that the consequence of the high energy prices of the past decade is a current—and at least for the next several years—significant increase in supply and decline in prices. Natural gas prices have fallen by 28 percent over the past year, and by 68 percent since 2008. With the expansion of shale gas supplies expected over the coming years, there is little likelihood of any mid-term increase in natural gas prices for BC’s exports, with continued declines a more likely scenario.
3 Merchandise Exports to East Asia

What we sell to East Asia are overwhelmingly a) forest products (37 percent; wood accounts for 20 percent and pulp and paper for 18 percent); b) coal (34 percent); and c) metallic minerals (17 percent), with these three commodity groups accounting for 88 percent of our exports to East Asia. The growth of East Asia from a 19 percent share of BC’s merchandise exports in 2001 to a 40 percent share in 2012 (estimated) is essentially the result of maintaining sales to Japan in the range of $4 billion per year while sales to South Korea almost tripled (from $700 million to $1.9 billion) and exports to China increased almost eight-fold (from $700 million to $5.5 billion). To the extent that future opportunities will be focused on China’s growth, and the challenges will be with slow growth or decline in Japan, it is reasonable to anticipate a similar pattern of exports moving forward.
East Asia economic growth. In any discussion of economic growth in East Asia, it is important to touch on its demographic context: East Asia is a region whose population has essentially stopped growing and is aging. Any growth in domestic demand from this part of the world will, therefore, be entirely driven by standard of living increases, specifically in China. In terms of growth projections, China’s economy is projected to growth by around eight percent next year, reflecting the re-focusing on economic conditions now that the leadership selection has been completed. In contrast, growth in Japan’s economy is expected to continue to drift downwards towards one percent per year as political uncertainty, conflicts with China, Korea and Taiwan, and a shrinking consumer market stymie growth in the national economy. South Korea, Taiwan, and Hong Kong are all expected to see growth in the range of 2.9 to 3.1 percent—respectable growth to be sure, but below long-run trends.

Coal Exports to East Asia. BC is Canada’s coal exporting province, overwhelmingly producing metallurgical coal, with only one mine (on Vancouver Island) producing thermal coal. Total coal production in the province has been in the 25 million tonnes range over most of this decade; however, so far this year, trends indicate that record production in the range of 29 million tonnes may be achieved. BC has experienced significant growth in export revenue from coal sales, concentrated in East Asia, largely as a result of long-run increases in coal prices combined with the entry—and rising prominence—of China as a market for BC’s exports. East Asia now accounts for 70 percent of the province’s coal export revenues, with sales to Japan holding steady in the range of $1.8 billion per year, while sales to South Korea have been quite volatile, dropping from $1.7 billion in 2011 to just over $1 billion this year (estimated). China has become our second biggest coal purchaser over the past five years, ahead of South Korea.

Coal prices have fallen significantly over the past year, as a result of both supply expansion and economic slowdown. While prices for metallurgical coal are expected to firm up in 2013, the active expansion of US, Indonesian, Mongolian and Australian exports of thermal coal will continue to push prices down into the $90/tonne range over the next couple of years. While not of direct concern for BC’s coal producers, low-cost thermal coal is of concern for natural gas exporters, as the former is a substitute for the latter in power generation. The combination of economic recovery in East Asia and strengthening prices for metallurgical coal will bring anticipated growth in coal revenue for BC, subject to the impact of increased competition from producers in Australia, Indonesia and Mongolia.

Wood Exports to East Asia. The picture of decline in the value of BC’s wood sales to Japan, from almost $3.0 billion in 1996 to an estimated $1.0 billion in 2012, follows the same direction as wood construction in Japan over the same period, compounded by increased competition from other suppliers, particularly in the EU, in the Japanese market. Given Japan’s demography, the most likely scenario for the near- and mid-term is a continuation of sales in the recent range of $1 billion, gradually declining over the longer-run.

Given this, any significant growth in wood exports in East Asia will hinge on the ultra-competitive Chinese market for wood products—a market in which Russia, Finland, and South East Asian countries are very active. In this regard, the recovery of lumber prices from their decade-low in 2009 can be expected as a result of the sharp growth in demand from China and the beginning of the recovery in the US housing market. (The opportunities to sell wood into the Chinese market are, of course, subject to the same supply constraints as are sales to the US.)

Pulp and Paper Exports to East Asia. China has become the single largest market for BC’s pulp and paper, accounting for 42 percent of all of the BC’s international pulp sales, compared to 31 percent for second-place USA; between them, these two countries account for almost three-quarters of the province’s international export of pulp products. Again, the East Asia picture is one of steeply declining sales to Japan over the past two decades as its economy slowed and other fibre suppliers entered the market, while sales to China increased dramatically as its economy expanded over the same period. Over the past year pulp and paper purchases by China have declined, paralleling the decline at the beginning of the recession, as the consequences of low demand for Chinese manufactured products from Europe and North America are expressed in the pulp market and the resultant decline in pulp prices over the past year. Given the projections for Chinese economic growth, demand for BC pulp and paper products should hold in the $1.75 billion neighbourhood as a result of both firming prices and increased sales, subject to BC being able to maintain market share in the face of increased supply competition.

Metallic Mineral Exports to East Asia. East Asia purchases two-thirds of BC’s metallic mineral exports, compared to the US’s 25 percent share. Given the structure of manufacturing in East Asia, the largest share of these exports (38 percent) goes to Japan, with the volume and value climbing sharply from 2004 on. The share going to each of South Korea and China (roughly one-eighth), increased more gradually over the past decade.

Along with coal and natural gas, there has been a significant long-run increase in the unit price for BC’s metallic minerals and a more recent decline (except for gold prices). With the recovery in the US and Chinese economies, it is reasonable to anticipate some firming of these commodity prices, although there may be some continued turbulence in sales patterns as the meshing of East Asian economies that underlies the use of metals in manufacturing that developed over the past decade is under significant stress as a result of the various political and business conflicts currently happening in East Asia. As such it is prudent to anticipate a relatively flat market for metallic minerals (and hence BC’s exports of them) over the next couple of years.
4 International Services Exports
As noted above, services account for approximately 25 percent of BC’s international exports, and hence warrant brief comment when we are discussing directions of change in BC’s economy.
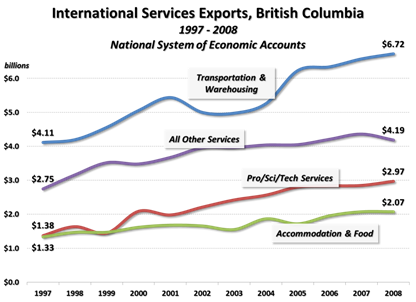
The value of the province’s international services exports has been steadily increasing over the past decade: between 1997 and 2008, international services sales grew by 67 percent, going from $9.6 billion to $13.1 billion.[1] While a vast array of sectors comprise the basket of services sold by BC to other countries—including professional, scientific, and technical services (17 percent of the value of BC’s international services exports over the past decade), accommodation and food services (13 percent), and finance, insurance, and real estate (eight percent)—the transportation sector warrants comment, not because it independently contributes to BC’s export base, but because it is inexorably tied to the export of resource commodities such as wood and coal, and to a lesser extent oil and gas.
The transportation and warehousing sector is the largest, by value, in the province’s international services export landscape. Between 1997 and 2008 it generated an average of $5.4 billion in income for BC, representing 41 percent of provincial international services export sales.
A link can be seen between recent growth in the value of BC’s international transportation exports and increasing sales of wood and pulp exports to China and increasing coal exports to China, Japan, and South Korea—which is not surprising given that this sector is facilitative in nature, bridging the process of commodity extraction and generation within our provincial borders with the ultimate sale (and delivery) of these products to overseas customers. As such, our outlook for this sector mirrors that for the commodity prices and export trends, as well as the economic growth expectations for BC’s key export markets, including China, South Korea, Japan, and the US.
IV Conclusions
The preceding sections outline some of the dimensions of our discussions of international factors as they may affect the BC economy, and our demographic and economic projections, over the coming few months and years. The discussion is more descriptive and subjective than our projection work, as it relies much more on the interpretation of trends than on the analysis of data. As such it does not form an input to our models, but rather conditions how we might interpret data on such things as international and inter-provincial migration, the supply of labour and employment trends, and tourism levels. It also points us to areas that warrant particular attention in the future. We find our periodic discussions of these matters of both interest and value, and we hope that you do as well.
V Data Sources
1. Canada-US Exchange Rate, page 2
http://www.statcan.gc.ca/pub/11-210-x/2010000/t098-eng.htm
2. Change in Canadian Dollar Purchasing Power of Currencies for Major Export Customers, page 2
data source - UFI calculation
http://www.bankofcanada.ca/rates/exchange/monthly-average-lookup/
3. Percentage Distribution of Canadian Dollar Value of BC’s International Merchandise Trade, page 4
data source – UFI calculation
http://www.bcstats.gov.bc.ca/StatisticsBySubject/ExportsImports/Data.aspx
Monthly data for B.C. exports with selected destination and commodity detail
4. Merchandise Exports charts (x3), page 5
2012 est by UFI from Jan-Sept data
1991 to 2011 from
http://www.bcstats.gov.bc.ca/StatisticsBySubject/ExportsImports/Data.aspx
Annual data for B.C. exports with selected destination and commodity detail
5 New Privately-initiated Housing Units Started, United States, page 6
projection by UFI
http://www.census.gov/econ/currentdata/dbsearch?program=RESCONST&startYear=1959&endYear=2012&categories=STARTS&dataType=TOTAL&geoLevel=US¬Adjusted=1&submit=GET+DATA
6. Annual Natural Gas Prices, Henry Hub Gulf Coast , page 7
http://www.eia.gov/dnav/ng/hist/rngwhhdm.htm
7. Merchandise exports to East Asia, pages 7 to 10
See 3. and 4. above
8. Annual Coal / Metallic Mineral Prices, page 8 / 10
http://www.empr.gov.bc.ca/Mining/MineralStatistics/Market/WeeklyMetalandCoalPrices/Pages/default.aspx
9 Forest Product Price Indicies, page 9
Business Indicators, BC Stats
http://www.bcstats.gov.bc.ca/Publications/PeriodicalsReleases.aspx
Business Indicators (MONTHLY) October 28
[1] The data presented here on BC’s international services exports are from Canada’s National System of Economic Accounts, and are not directly comparable to the data describing BC’s international merchandise exports, which are collected on a customs basis. Note that the most recent data on BC’s international trade in services are from 2008.