
People & Jobs in British Columbia's Future:
A Scenario for BC's Labour Market to 2041
The Urban Futures Institute

A Growing & Changing Population
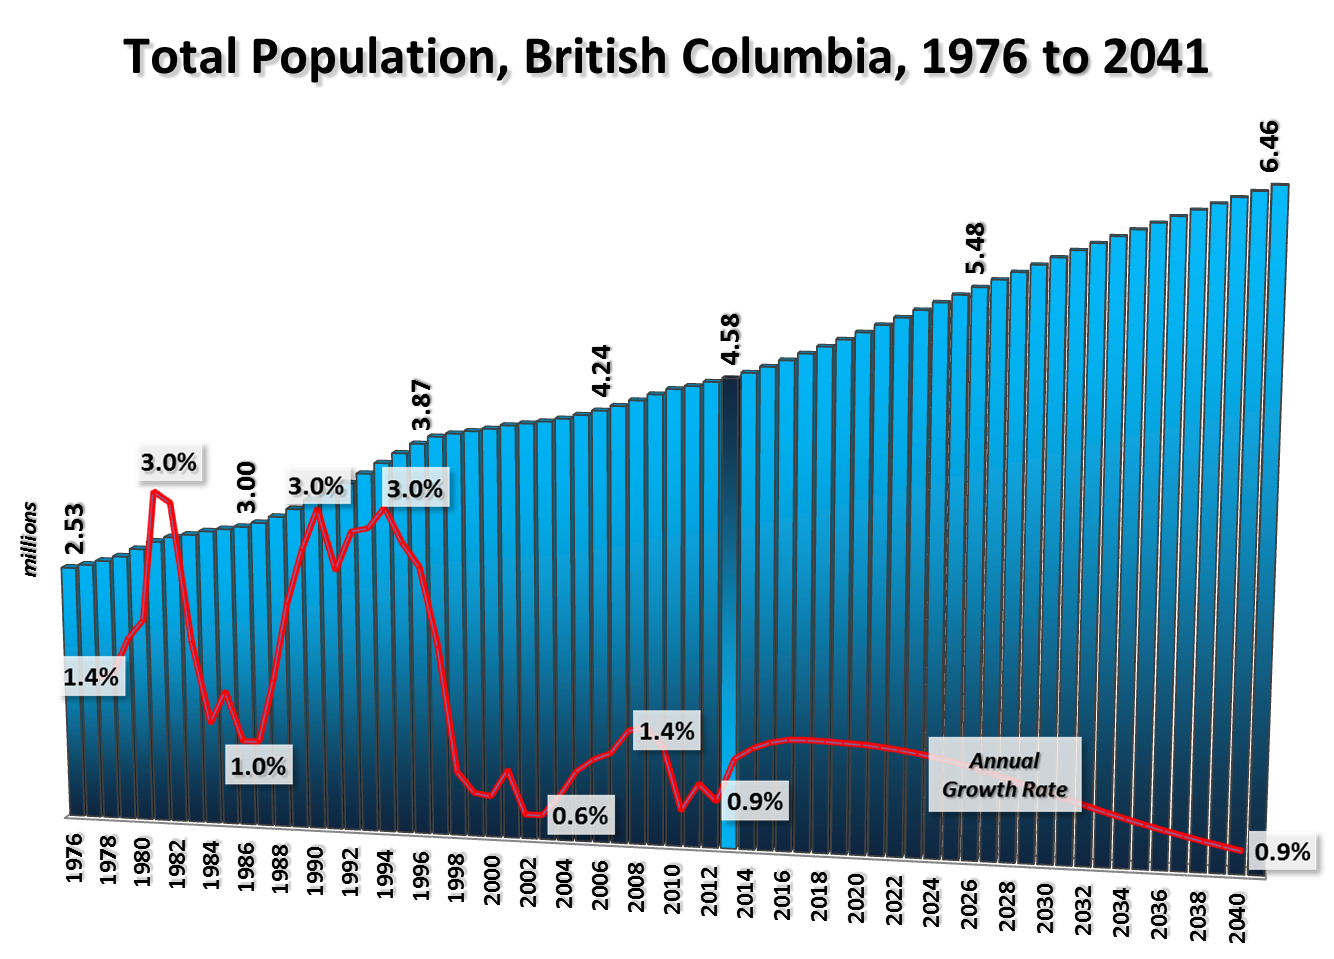
British Columbia has seen its population grow by more than two million residents since 1976, going from 2.53 to 4.58 million people (in 2013). This overall growth of 81 percent translated to an average annual rate of expansion of 1.6 percent. That said, actual rates of annual growth deviated around this average, achieving several peaks and troughs. After relatively significant annual increases in the early-1980s (the 3.0 percent growth in 1980 being the most notable), average growth rates fell towards one percent through the mid-1980s as the provincial economy, and migration to BC, slowed.
Through the late-1980s to mid-1990s the province’s population expanded more rapidly, driven in part by the pull of a growing provincial economy and in part by the push of both slower economic growth in eastern Canada and the impending transfer of Hong Kong’s sovereignty from the United Kingdom to China in 1997. Overall, the years spanning 1987 to 1997 saw the province’s population grow at an average annual rate of 2.6 percent, with peaks of three percent seen in both 1990 and 1994.
Following this period of above-average growth, BC’s economy slowed, resulting in population growth falling just below one percent in 1998 and further to 0.5 percent by 2002. The 1998 to 2008 period saw the province’s population expand at an average annual rate of 1.1 percent, characterized by lows of 0.6 percent in 2002 and 2003 and a peak of 1.4 percent in 2008.
Considering the most recent past, population growth in BC—and in many other Canadian provinces—picked up steam through the late-2000s, reaching a peak of 1.4 percent in 2008 and 2009. The Great Recession of 2008/09 resulted in an abatement of growth both provincially and nationally, with annual population growth rates dipping to one percent in 2012. Current estimates for 2013 show a slight uptick in the growth rate, to 1.1 percent.
In looking ahead, the provincial population is projected to grow by a further 41 percent by 2041 through the addition of 1.87 million residents. Changing demographics will see annual growth rates fall below historical levels over this period, however, as they would average 1.1 percent between 2013 and 2041. That said, BC is expected to experience the second-fastest rate of growth over this period when compared to other Canadian provinces, behind only Alberta. In absolute terms, Ontario—with its large population today—is projected to add the greatest number of residents by 2041.
Components of Future Demographic Change
Migration will continue to be the predominant driver to population growth in BC in the coming years, with net international migration (as opposed to net inter-provincial migration) continuing to have the greatest influence on the province’s population, just as it has since the early-1990s. More specifically, the process of people moving to BC from other countries (including both permanent and temporary residents) would add an average of more than 47,000 people each year to the province between 2013 and 2041. While above the 39,000 currently being added annually (and the 32,000 added annually over the past three decades), this sustained level of net immigration would still be below the peak levels seen in the mid-1990s (45,000 annually) and in the late-2000s (47,000 in 2007 and 52,000 in 2008).


Comparatively, net inter-provincial migration (people moving between BC and other Canadian provinces and territories) is projected to add many fewer people to the province each year than would net international migration. More specifically, net inter-provincial migration is expected to be in the range of a net gain of 10,000 to 12,000 people per year in the near-term, before increasing towards 16,000 by 2041. On average, net inter-provincial migration is expected to add 14,600 people to the province annually to 2041.
While mortality is projected to take away an average of almost 48,000 people from BC each year to 2041, the annual number of births province-wide is expected to be in the neighbourhood of 50,000. That said, given the province’s aging population, the annual contribution of natural increase (the number of births minus the number of deaths) would fall from 13,600 additions today to a loss of 600 people by 2031 (thereby marking the transition from natural increase to natural decrease, as there would be more deaths than births). This loss would then increase to 13,000 annually by 2041.
In summary, the trends in migration (described above), combined the processes of aging and natural increase, will be associated with two major provincial and national trends: an influx of young migrants (predominantly from international origins), and a substantial increase in the size of our seniors population.
Influx of Young Migrants
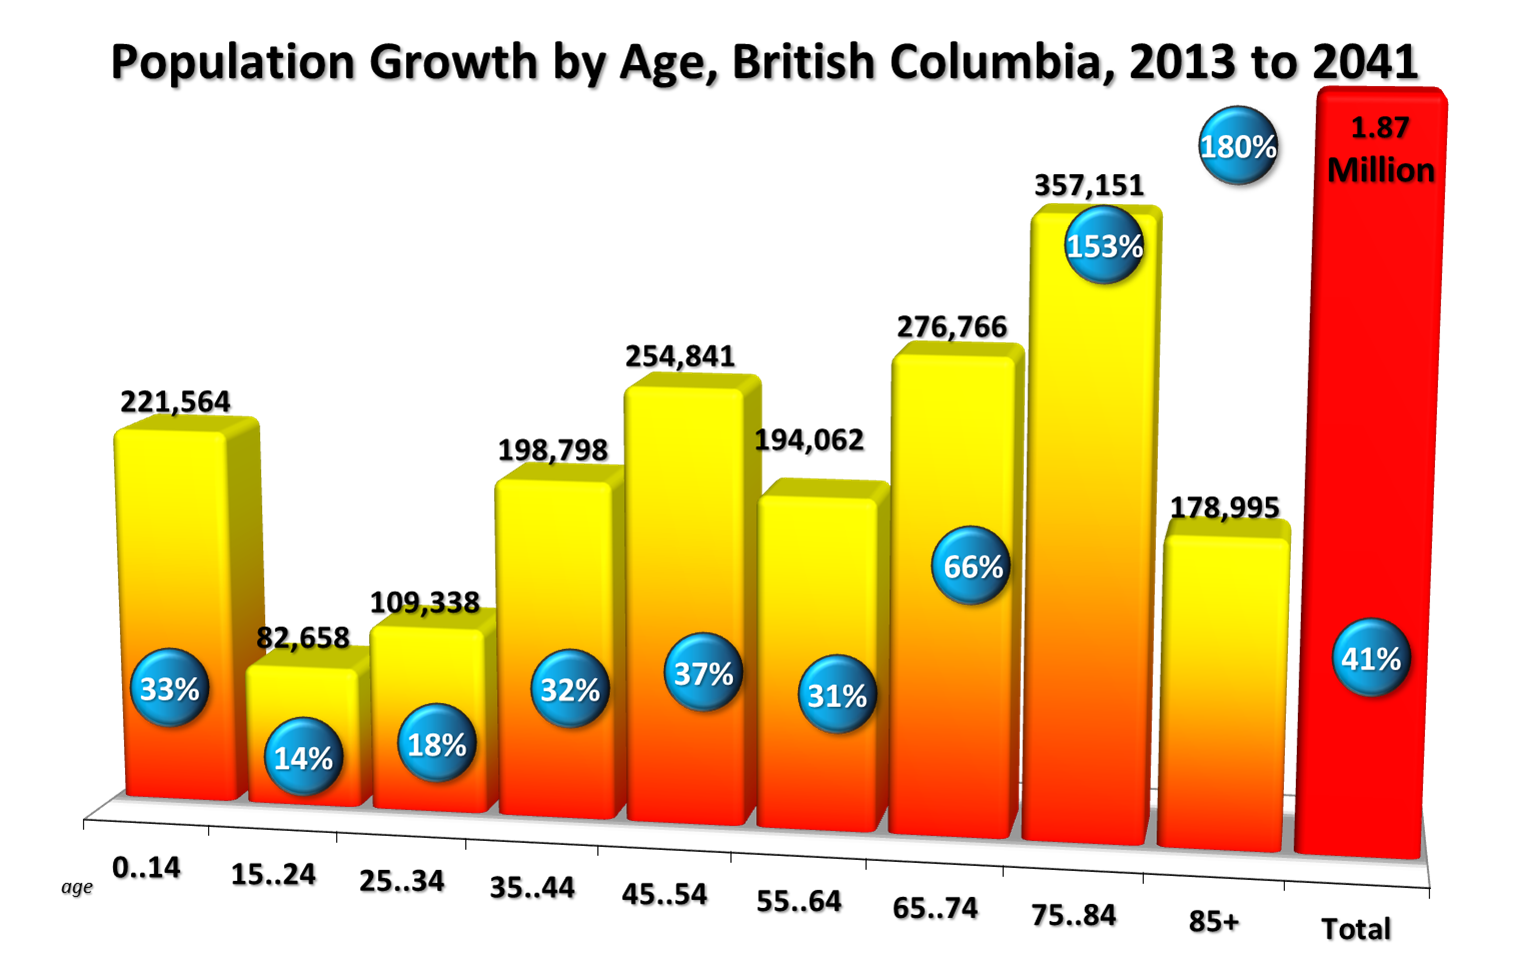
The youthful profile of migration to the province from both international and domestic sources will have an impact on the size and composition of BC’s younger cohorts. More specifically, it is expected that BC will continue to attract younger migrants, which will enable it to maintain a younger age profile than Canada as a whole. For instance, BC’s under-15 age group is expected to grow by 33 percent by 2041 (versus 15 percent nationally) and its 15 to 24 population is projected to grow by 14 percent (versus eight percent Canada-wide). BC's prime working-aged population (25 to 64) is also projected to grow more rapidly than the national average, posting a 30 percent growth provincially and 13 percent nationally.
Aging Baby Boomers
More significant change will characterize the province’s older cohorts, with the greatest absolute and relative growth projected for the province being in the 65-plus age groups. More specifically, aging and migration would see the province’s 65 to 74 population grow by 66 percent, the 75 to 84 group by 153 percent, and the 85-plus group by 180 percent by 2041.
While 16 percent of BC’s population is currently (2013) aged 65-plus, this is projected increase to almost a quarter (24 percent) of the population by 2041. Conversely, as a result of the aging of the baby boom cohort out of the prime working stage of the lifecycle (25 to 64 years) towards retirement, the share of the provincial population of working age would fall from 56 percent of BC’s population today to 51 percent by 2041.
The significant growth that will come to the older age groups is even more evident when considered on an absolute basis. For example, the 108 percent increase in the 65-plus population would equate to more than 810,000 additional seniors in the province by 2041; there would on the other hand be a 760,000-person increase in the province’s working-aged population ( 25 to 64) as it grows by 27 percent. Thus, for every senior in BC today there would be 2.1 by 2041, while for every person of working age today (25 to 64 years) there would only be 1.3 by 2041. As such, a significant shift in the province’s demography will be seen in the coming years, in large part driven by the aging of the 26 percent of the province’s population that is currently between the ages of 48 and 67 (the post-war baby boom generation). This shift will have significant implications for the growth and composition of the provincial labour force and, by extension, the ability of BC’s economy to expand.
Labour Force Change

The link between the province’s changing demography and the number of people in its labour force can be considered through the lifecycle pattern of labour force participation. More specifically, labour force participation rates can be considered on an age specific basis, defined as the percentage of people in an age group that is either working or actively looking for work.


Over the past 30 years, female age-specific labour force participation rates have increased significantly. In the under-55 population the most significant increases were seen prior to 1991, with more modest increases occurring over the past couple of decades. In contrast, the 55-plus age groups have been characterized by more robust increases in female labour force participation over the more recent past. On the basis of these recent trends and a relative tightening expected in provincial and national labour markets, continued increases in female age-specific labour force participation rates are expected to characterize the coming decades. Within the younger stages of the working lifecycle, recent trends in labour force participation and the expectation of relatively constant birth rates, and a continuation of high post-secondary education participation, relatively modest increases are expected for females in the younger age groups when compared to the historical experience. The most significant increases in female labour force participation are expected to be in the 55-plus groups, driven in part by long and increasing life expectancies and a “pulling-forward” of past labour force experiences into the older groups as females age into subsequent age groups.
In contrast to the patterns seen for females, male labour force participation rates have declined in BC for all of the under-65 age groups over the past thirty years. That said, recent evidence indicates that the declines have all but ceased, providing the basis for a projection of increasing male labour force participation in all age groups. Again, recent trends and tight labour markets are expected to drive this outlook, with male participation rates in the 30 to 59 age groups moving back towards historical peaks, and to new highs for the 60-plus age groups. Again, given the emphasis on post-secondary education that our skilled workforce requires, significant increases in male labour force participation are not expected to characterize the under-30 population.
A Growing & Changing Labour Force
Combining the projections of increasing age and sex specific labour force participation rates with the projections of demographic change for the province results in an outlook for BC’s labour force. In the labour supply context, the relatively slow growth of the working-aged population will in part offset the expected increases in participation rates—particularly the increases in the rapidly-growing 55-plus age groups where participation rates decline more significantly with increasing age.

British Columbia’s labour force is projected to grow from its current 2.49 million people to 3.49 million by 2041, translating to just over a million additions (1.04 million to be exact) to BC’s labour force. While this magnitude of growth may appear to be significant, it represents only a 40 percent increase over the next 28 years. As a point of comparison, the past 28 years saw the province’s labour force grow at almost double this rate (76 percent).
While growing more slowly than it has historically, BC’s labour force will experience much more significant change (in terms of its age composition): in addition to international migration significantly changing the face of BC’s labour force through new additions to the province, the inevitable process of aging will also tilt its composition towards the older age groups. For example, while 20 percent of BC’s labour force is currently aged 55-plus (and four percent is 65 and older), almost a quarter of the labour force would be 55 or older, with the share aged 65 and better increasing to seven percent.
This pattern of labour force growth, driven by both changing demographics and age-specific participation, will have significant implications for potential economic growth in the province in the coming years. Recognizing that there will always be some level of unemployment due to both structural and frictional adjustments (that is, skill mismatches and transitions between jobs), the province is facing a future where labour supply may come to constrain the ability of our economy to grow. For example, the 40 percent labour force growth to 2041 implies that BC’s supply of workers would expand by an average of only 1.2 percent per year. Any growth in real GDP above the average annual increase in the province’s available supply of labour will therefore need to be achieved either through further increases in age-specific participation, by a reduction in unemployment levels, or in the form of productivity gains (on the part of both new and existing workers).
An Outlook for Future Economic Growth & Employment

A Growing Economy
Since 1976, employment in British Columbia has grown from 1.08 to 2.32 million jobs (in 2013), a 114 percent increase. Over the same period the provincial population grew by 81 percent, the labour force by 110 percent, and real provincial Gross Domestic Product (GDP) by 175 percent. As a result of these changes over time, a couple of trends have emerged. First, the reality of employment growing faster than the labour force has resulted in a generally declining unemployment rate over time (from above eight percent in the late-1970s, and a high of 15 percent in 1984, to 6.6 percent by 2013). Second, when BC’s real GDP growth is compared to growth in employment, an increase in total real output per worker is seen over time, from just over $71,030 per job in 1976 to $91,230 by 2013. While it is recognized that there are many ways in which to frame measures of productivity, the widely-used statistic of real GDP per worker generally demonstrates an increasing efficiency in the relationship between employment and production.

Similar to the province’s population and labour force, BC’s employment has been characterized by several periods of growth and decline over the preceding four decades. While employment in the late-1970s early-1980s was characterized by significant growth (four to six percent per year), 1982 saw a five percent contraction, followed by a further one percent decline in 1983, the result of contractionary monetary policies in North America aimed at combating high inflation. As a result, these two years alone saw the province lose almost 80,000 jobs. The following 14 years saw BC’s employment grow, most notably by 5.3 percent in 1989 and by 4.6 percent in 1994.
Declines in provincial employment were seen in 1998 (a 0.3 percent decline), 2001 (a 0.5 percent decline), and perhaps most notably in 2009 when employment fell by 2.5 percent in the province as 58,000 jobs were lost. More recently—and much less talked about—was the decline in 2013 as employment province-wide declined by 0.2 percent or by 4,000 jobs.

Based on historical changes in employment in the province and its relationship to changing economic activity (as reflected in GDP), an outlook for employment change in BC can be developed. In this context, what is needed is a long-range projection of changes in real GDP. Beyond the short-term projections provided by the Economic Forecast Council and the Ministry of Finance—which expects annual economic growth to be in the range of 2.7 percent to 2017—no long-range assessment of growth in the provincial economy exists. As such, in looking to project economic activity beyond 2017, two considerations were made: one, that the long-range trend in real provincial GDP has been one of slowing growth; and two, that trends in the province’s demography will lead to slower growth in the provincial labour force (as outlined above). In light of these considerations, annual changes in BC’s real GDP is expected to fall below two percent over the medium-term and further towards 1.6 percent by 2041. This pattern of growth would see real GDP in the province grow from $212 billion today towards $366 billion by 2041.
The relationship between jobs and real GDP in this province for the past two decades-which generally represents two full economic cycles within the province-when combined with the outlook for provincial GDP growing by 72 percent would see total employment in the province grow by 44 percent to 2041 as just over one million net new jobs are added. This would see annual employment growth average 1.3 percent over the coming three decades, below the 2.1 percent per year seen since 1976.
The Challenge for BC’s Labour Market
As indicated above, a potential limiting factor for economic growth in BC will be the ability (or inability) of the provincial labour force to keep pace with the increasing demand for workers. More directly, with an outlook for the future and supply of, and demand for, workers in the province, the tension between the province’s economy and its underlying demography can be measured by changes to the unemployment rate. Generally-speaking, with the province’s workforce expected to expand more slowly (by 1.4 percent annually) than employment (1.5 percent), the expectation is for a declining unemployment rate as labour force growth is expected to lag employment growth.

Given the economic and demographic outlooks presented above, British Columbia’s unemployment rate would fall back towards the four percent mark last experienced in late-2000s due to shifts in the province’s demography. Under this scenario, BC’s economy would reach “full employment” (where the only unemployment is structural and/or frictional) by early 2020. From this point forward, BC’s demography would constrain job growth by virtue of there simply not being a large enough supply of workers to meet expected demand.
Several approaches can be considered as means of resolving the economic challenge presented by our demographic reality. The first would be to focus on participation. The labour force outlook presented herein already projects age specific participation rates to increase over the coming decades, to record highs for females and back to peak levels for males. If labour force participation increased even more than that projected here, there would certainly be a greater supply of labour in the province, thereby reducing the gap between projected labour demand based on economic trends and projected labour supply based on demography. That said, given where the bulk of the provincial population is expected to be in the coming years, to have significant impact would require the 55 plus age groups to seen more significant increases than projected here. While possible, everyone has aspirations of retiring sometime!
Another approach would be to focus on the population—in other words, expanding the number of people living in BC beyond what is presented in the current set of projections. Common approaches to achieving this range from increasing birth rates to changing immigration levels. From the fertility perspective, future gains would be at best modest, as a large share of the province’s population has aged out of the family formation stage of the lifecycle. Furthermore, any child born today would not be a factor in the labour force for at least another two decades. From the immigration perspective, the current demographic projection for BC is based on the assumption that immigration at the national level will rise beyond historical peaks in the short-term (towards an immigration rate of 0.80 percent of population, up from 0.73 percent today) in order to mitigate the impact that changing demographics will otherwise have on the national labour force. While certainly possible, the probability of achieving immigration rates above the 0.80 percent level would need to be considered, as competition for young, skilled workers grows around the world as other countries struggle with the long-range consequences of their own post-war baby booms.
Finally, there is the consideration of productivity. Discussions around changing productivity levels within the Canadian economy are wide and deep and have attracted much attention in recent years. Within this discussion, there is a general consensus that while productivity growth has been impressive Canada-wide over the past half-century, much of it occurred in the 1960s and 1970s, with much smaller gains in productivity occurring since. It is important to note that in the context of the employment projections presented above, historical increases in productivity are implicit in the historical relationship between BC’s real GDP and employment, and thus would be reflective of gains that could be expected in the coming years. In this context, given the much smaller gains in productivity that have characterized the Canadian workforce over the more recent past, a paradigm shift would have to be seen with respect to productivity gains—a shift that would need to be realized during a period of significant population and, more importantly workforce, aging.
While the “3 P’s” framework is commonly cited as an opportunity to address BC’s labour market challenges, there is always the perspective that BC’s just does not need as much economic growth in the coming years. While some may be content with lower levels of economic growth, it is important to acknowledge that it is the level of economic activity in the province that generates the resources required to pay for the range of necessities and luxuries demanded by BC’s residents, from funding of health care and pension plans to our spending on yoga mats and Goretex jackets.