
Averages & Anecdotes, 2012 Update: Deciphering Trends in Real Estate Prices
Andrew Ramlo & Ryan Berlin
The Urban Futures Institute

In the spring of 2011 headlines about lofty gains in Canadian and Lower Mainland real estate markets relied on average prices to describe current price trends. Given these headlines, we were able to show how the arithmetic average can be skewed by outliers in the data and how simple averages did not adequately represent the true market contexts, either locally or nationally.
For example, in reference to 2010 sales data, the Canadian Real Estate Association (CREA) published this statement:
“A record number of multi-million dollar property sales in Richmond and Vancouver West are pushing up average prices for Greater Vancouver, British Columbia and nationally. If Vancouver is excluded from the equation, the national average price increase is cut by more than half to 4.3 per cent.”
As shown by the CREA quote, using average prices as descriptors of changes in the housing market suffers from the fact that extreme values at either end of the distribution distort the true picture. Given this, in 2011 we looked into the 2010 sales date to see how multi-million dollar home sales in the Greater Vancouver market were skewing the picture within the Lower Mainland.
In considering the 2010 sales data for the Lower Mainland region we saw that while the average price for all single detached sales in 2010 was $810,398, the average price net of the top price quintile was $591,092, or 27 percent below the overall average. This represents the average price for the least expensive 80 percent of sales which, it could be argued, are more representative of what most people would be purchasing. Similarly, while the average sales prices for all condo/apartment units in 2010 was $429,764; if the upper-most quintile was removed, that average sales price was a much lower $311,069.
With discussions today more focused on a cooling of the National and local real estate markets than lofty gains, we decided to look at the 2012 sales data for the Lower Mainland to see how the distribution of sales prices has changed from the sales in 2010 considered in our previous research.
But before we get to the numbers, it is important to recap a couple of quick definitions. The ‘average’ (or arithmetic mean), as a concept, has become the commonplace measure of central tendency, with the perception that it gives us a middle-of-the-road picture about a given scenario, or a neat “summary” of a wide range of outcomes or characteristics. Consider, however, a community centre where one room is occupied by a number of seniors playing bridge and the other by kids in daycare. While the average age of the people in these two rooms would be somewhere in the range of 40 years old, it would be erroneous at best, and misleading at worst, to use the average as an indicator of daily activities at the community centre. Another statistical measure that is not as adversely impacted by outliers in the data is the ‘median’ or the numerical value separating the higher and lower half of a data set. This would involve lining up everyone in the community centre by their age and counting to the person who sits right in the middle of the data set and asking their age.
Another approach to considering the extent to which average prices are being influenced by outliers (either very high or very low values) involves segmenting the sales price data into ‘quintiles’ and examining how prices and volumes change within each quintile. This involves ranking all sales from lowest to highest and then creating five price groups containing an equal number of sales (rather than just the midpoint for the median). Thus, each price range would contain 20 percent of the total number of sales in that year. This is essentially the same concept of the median, only broken up into five groups instead of two.
2012 Residential Property Sales in the Lower Mainland
The 2012 sales data show that there were 47,451 residential property sales in the Lower Mainland region, nine percent more than the 43,352 in 2010. Compared to this nine percent increase in the volume of sales, average sales prices were up less dramatically: overall sales prices in the region averaged $657,054 in 2012, six percent above 2010 levels. Over the same period, however, median sales prices were essentially flat, at $481,000 in 2012 and $480,000 in 2010. The difference between changes in the average and the median is a simple indicator of the extent to which the underlying data are skewed; in this case, changes in sales volumes were somewhat skewed toward the higher end of the sales prices spectrum.
Detached Units:
Considering sales by property type, there were 22,097 detached units sold in the Lower Mainland in 2012, one percent more than the 21,901 in 2010. Average sales prices for detached units increased more significantly: detached sales prices averaged $913,023 in 2012 compared to $810,398 in 2010, a 13 percent increase. Over the same period the median sales price for detached properties increased more slowly, growing by seven percent, from $640,000 to $685,000, indicating a greater degree of activity in the most expensive sales.
Figure 1 shows that when all sales of detached units are ranked by price and grouped into quintiles, the influence of multi-million dollar sales becomes evident. In considering the top quintile (or top 20 percent of sales by value), which ranged up to a sales price of $20.31 million, the average price for these sales was a lofty $2.07 million, more than twice the average price for all sales.
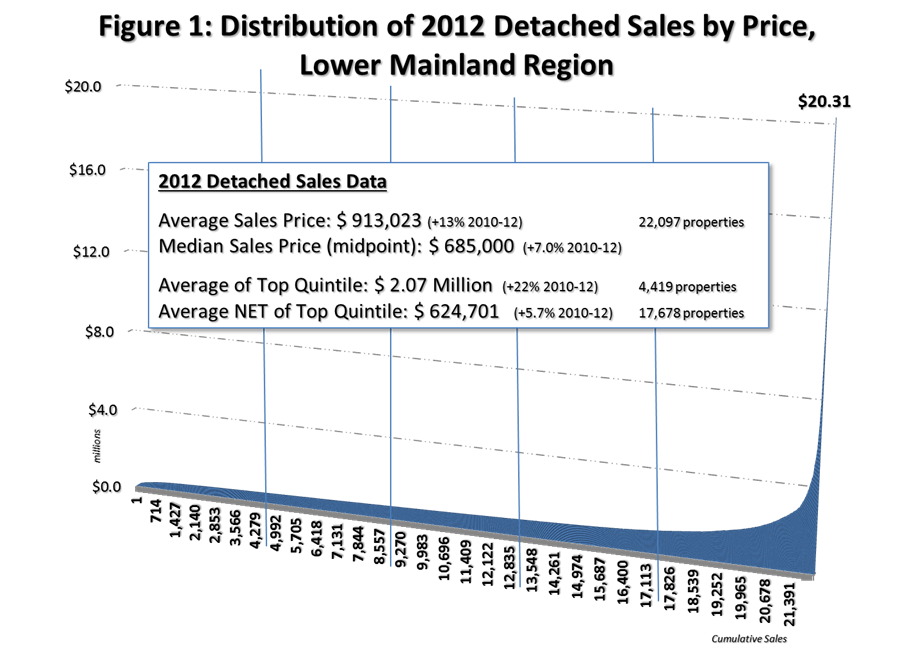
The average sales price net of this top quintile, however (i.e. the other 80 percent of sales), was $624,701, 32 percent below the overall average sales price that included the most expensive sales. When price changes between 2010 and 2012 are considered, average prices for the top quintile increased at almost four times the rate of sales in the bottom 80 percent of the market: relative to the 22 percent increase in prices of detached properties in the top quintile, the other 80 percent of sales increased by only 5.7 percent.
Attached Units: Looking at the attached segment of the market, there were 8,536 sales throughout the Lower Mainland in 2012, a 17 percent decline from the 10,292 units sold in 2010. Interestingly, while sales volumes fell over this two-year period, average sales prices actually increased (marginally): attached sales prices in the region averaged $455,133 in 2012 compared to $450,206 in 2010, a 1.1 percent increase. Over the same period, median sales prices decreased by 2.1 percent from $398,500 in 2010 to $390,000 in 2012.
Ranking all sales of attached units by price and grouping them into quintiles shows the significant deviations in the number and price of multi-million dollar sales relative to the bottom 80 percent of attached sales (Figure 2). Considering the top quintile, which saw sales prices range up to $6.69 million, the average sales price for these most expensive properties was $804,043, almost twice the average for all attached sales.

The average sales price for attached units net of the top quintile was $367,854, 54 percent below the average price associated the most expensive sales (i.e. the top 20 percent). When price changes between 2010 and 2012 are considered, increases in sales prices over the two years has been concentrated in the top 20 percent of the market: average prices in the top quintile increased by 4.3 percent while the lowest-priced 80 percent of sales decreased by half of a percent. So while the upper-end of attached sales saw price gains, the bottom 80 percent of all sales actually revealed slight declines.
Condo/Apartment Units: A similar situation is seen when the condo/apartment segment of the market is considered (Figure 3). In 2012 there were 16,544 condo/apartment sales in the Lower Mainland region, down 23 percent from the 21,451 in 2010. Following this considerable decline in volumes, average sales prices for condo/apartment units fell by 3.4 percent, from $429,764 in 2010 to $415,156 in 2012. The overall decline in prices for condo/apartment units between 2010 and 2012 also saw median sales prices declined by 1.5 percent from $345,000 to $339,900 in 2012.

Notably, the declines in average sales price were more significant at the top end of the market. While in 2010 the composition of sales of the upper-most 20 percent of properties by value resulted in a 2010 average sales price for that quintile of $904,338, the sales price of the upper-most quintile in 2012 averaged $862,901, a 4.6 percent decline. The average sales price for the remaining 80 percent of condo/apartment sales declined from $311,069 in 2010 to $303,212 in 2012, a drop of 2.5 percent. Thus, average sales prices for condo/apartments in the top quintile between 2010 and 2012 declined at twice the rate of those in the bottom 80 percent of this market, thus skewing the overall average sales price changes over this period.
This decline in the high-end segment of the condo/apartment market can, in part, be traced to the fact that in 2010 the highest condo/apartment sale price exceeded the top detached sale price (a $17,571,125 condo sale versus $17,500,000 for detached). The 2012 sales data show that the highest condo/apartment sale price was (only!) $7.24 million.
Concluding Thoughts
Price increases seen in both the detached and attached markets for the most expensive 20 percent of units serve to skew perceptions of both overall market activity in 2012, as well as, how prices have changed over the past two years. Again, while the average sales price of all detached units increased by 13 percent (which could be interpreted as a challenge within the context of affordability discussions), the price of least expensive 80 percent of units increased by less than half this rate (5.7 percent). Further, while the average sales price of all attached units increased by 1.1 percent, this increase was transformed into a decline of 0.5 percent once the most expensive 20 percent of units were excluded from the calculation.
For 2012, segmenting out the most expensive sales (the top quintile) from the Lower Mainland data results in regional price changes that are well below the “average” for all sales. More specifically, removing these top sales results in average sales prices $436,156 for the bottom 80 percent of the market rather than the $655,999 average for all sales. More importantly, “average” sales price growth of 5.5 percent between 2010 and 2012 is reduced to only a 1.1 percent gain if the bottom 80 percent of the market is considered. In closing, this brief analysis shows how a very different picture of price levels, and changes to them, emerge if broad-brushed averages are used rather than considering the underlying data in (just a little) more detail.
Drilling down a bit further to municipalities within the Vancouver region reveals another surprise: Surrey accounted for the greatest proportion of net additional rental units across the region. At more than 8,705 additions, this part of the region represented 39 percent of the CMA’s growth in rental accommodation.
The City of Vancouver, for all of the concerns about investor-owners, added about half of what Surrey did, accounting for 20 percent of regional rental additions. The rest of the rental housing growth was sprinkled throughout the region, with Burnaby accounting for seven percent, Coquitlam six percent, Langley Township five percent, and Richmond, New Westminster, and Port Moody each with four percent. All other municipalities throughout the Vancouver CMA account for the remaining eleven percent.