
2011 National Household Survey: Regional Patterns of Employment Change in BC - Where Did All the Jobs Go?
Yazmin Hernandez
The Urban Futures Institute
Recently- released data from the National Household Survey (NHS) show that in the spring of 2011 there were 2.17 million people over the age of 15 employed in British Columbia. Compared to 2006, when 2.09 million people were employed in the province, this represented a net gain of 78,705 jobs (3.8 percent total growth). While outperforming Canada as a whole over this five-year period (employment Canada-wide grew by 3.6 percent), job growth in BC was well behind growth seen amongst our Western counterparts: Alberta saw employment grow by 7.2 percent and Saskatchewan by 6.9 percent between 2006 and 2011.
Looking within the province, employment growth between 2006 and 2011 was geographically concentrated in only few regions. Of the province’s 28 Regional Districts, only ten saw employment grow, one saw employment remain constant, and 17 saw declines over the past five years. Put slightly differently, 57 percent of BC’s Regional Districts saw declining levels of employment between 2006 and 2011.
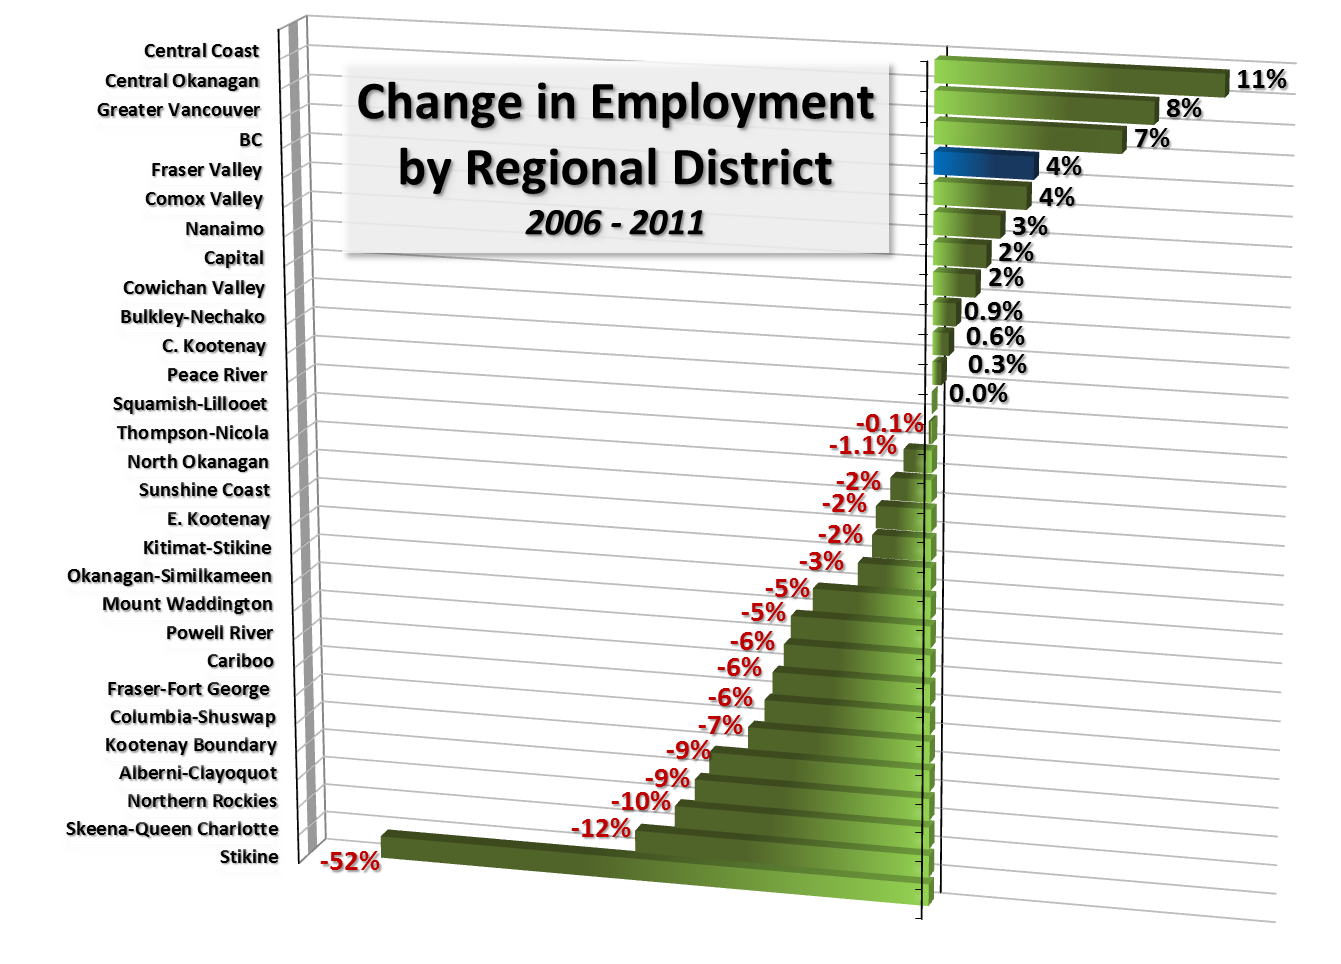
Of the regions that did grow, the Greater Vancouver Regional District (GVRD) grew the most, accounting for the equivalent of 99 percent of the total growth in employment seen provincially (77,635 out of 78,705 additional jobs). Along with the GVRD, aggregate growth in employment experienced by the ten regions that did grow totalled just over 173,000 additional jobs. Compared to the 3.8 percent province-wide average increase in employment, the majority of the regions that grew did so at a below-average rate, while only three saw employment grow faster than BC as a whole: the Central Coast (eleven percent; 125 new jobs), the Central Okanagan (eight percent; 6,730 additions); and Greater Vancouver (seven percent).
While employment remained relatively steady in the Central Kootenay region, employment declines were seen in the remaining 17 Regional Districts. On a relative basis the Stikine region experienced the greatest decline, as employment fell by 52 percent between 2006 and 2011 (325 fewer jobs). Similarly, the Skeena-Queen Charlotte region saw the number of employed fall by 12 percent, as 1,055 fewer people were employed by 2011. The third-largest relative decline was in the Northern Rockies, where employment fell by ten percent between 2006 and 2011 (365 fewer jobs).
In absolute terms, the largest decline in employment was in the Fraser-Fort George region, which saw a decline of 3,195 people employed over this five-year period; this represented 20 percent of the aggregate decline in employment seen amongst the 17 regions where employment fell. The Cariboo, Columbia-Shuswap, and Okanagan-Similkameen regions also saw significant declines, with 1,840, 1,685 and 1,605 fewer jobs in each region respectively by 2011 compared to 2006.
Although the ten regional districts in which employment grew accounted for more than 80 percent of provincial employment in 2011, considering the range of economic experiences across BC highlights the slow pace of employment growth (or decline) outside of the metropolitan centres of the Lower Mainland and the Central Okanagan.
Furthermore, these new NHS data raise questions about the reasons for these declines. To what extent were the declines in employment linked to each region’s economic base and, by extension, their ability to cope with changing global economic conditions? Furthermore, is the aging of local populations (and workforces) influencing the declines? These, and many others, warrant further research to provide some context for the significant employment declines seen in over half of the province’s Regional Districts.